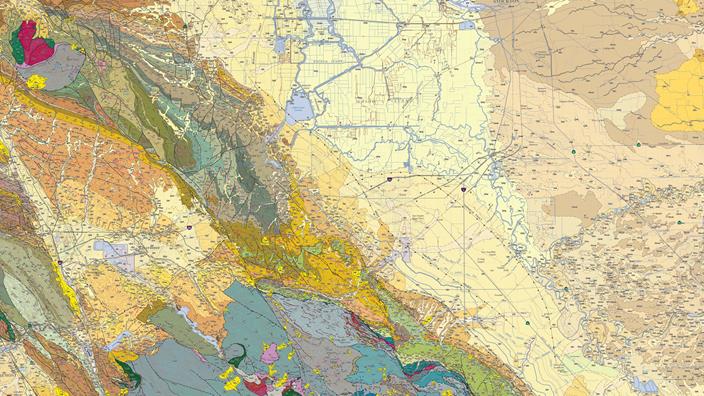
Compiled by M.P. Delattre, R.W. Graymer, V.E. Langenheim, K.L. Knudsen, T.E. Dawson, E.E. Brabb, C.M. Wentworth, and L.A. Raymond
This release consists of two PDF files: a 79-page pamphlet and one plate measuring 60 inches by 35 inches. The plate contains several map layers that can be enabled and disabled in a PDF-compatible application. The map layers depict general geology, faults, landslides, gravity and aeromagnetic anomalies, topographic contours and relief, and more.
To obtain the pamphlet and plate, visit
 California Regional Geologic Maps web page.
The pamphlet and accompanying geologic and geophysical maps are the products of cooperative efforts by the California Geological Survey and United States Geological Survey to compile a comprehensive, digital representation of the bedrock geology, Quaternary surficial deposits, and potential-field anomalies within the boundaries of the Stockton 30' × 60' quadrangle. The Stockton 30' × 60' quadrangle covers approximately 4,890 square kilometers of Contra Costa, Alameda, San Joaquin, and Stanislaus Counties in California. From the rugged hillsides of the northern Diablo Range in the west to the San Joaquin Valley in the east, the map extends roughly 88 kilometers across growing suburban communities of the eastern San Francisco Bay Area and Livermore Valley, grass-covered ranchlands along eastern slopes of the Diablo Range, and into the low farmlands of the San Joaquin Valley and Sacramento-San Joaquin River Delta. The elevation ranges from near sea level in the Delta to 1,173 meters on Mount Diablo, the most prominent peak of the San Francisco Bay region.
The Stockton 30' × 60' geologic map compilation is intended to illustrate the distribution of the rocks and surficial deposits of the area and their structural and stratigraphic relations to one another. The larger goal of the publication is to provide a regionally consistent picture of the geologic and geophysical framework to better understand the structural and stratigraphic relations across the region as an aid to natural resources management and evaluations of potential hazards from active earth processes.
The geologic map was compiled predominantly from 1:24,000- and 1:62,500-scale mapping. Although the map sheet was cartographically designed and formatted for display at 1:100,000-scale, details of the larger scale source maps were retained in the digital geodatabase. As a digital product, the map may be easily enlarged; however, the spatial accuracy of the data remains limited to that of the source maps. Similarly, the age and scale of topographic base maps used for the original mapping should be considered when overlying the digital compilation on newer base maps, which may produce apparent spatial discrepancies. Accordingly, it is important to recognize that neither the printed map sheet nor digital database is sufficiently detailed or spatially accurate to serve as a basis for site-specific evaluations.
