The California Geological Survey (CGS) has the responsibility of disseminating geologic information about California to its citizens, schools, private sector, and government. The traditional and most useful means of accomplishing this charge is to provide appropriate geologic maps. The CGS produces professional geologic maps at various scales, and derivative maps showing important aspects of geologic hazards or resources.
What is a Geologic Map?
A geologic map shows the distribution, relationship, and composition of earth materials such as rocks and surficial deposits (landslides, sediments) and shows structural features of the earth (faults, folded strata). Special purpose maps or derivative maps may only show details of faulting, landsliding, mineralization or other geologic processes or features. A geologist compiles the data to be presented on a map through the use of field observations, aerial photographs, remote sensing information, topographic information, soil survey information, and laboratory analyses. The geologic data, in layer fashion, are typically printed upon a base map. The base map may show the topography, roads, rivers, or other cultural or natural features in the map area. Modern maps are in digital form, extending their usefulness in decision-making by allowing geologic information to be combined with other data, such as demographics or infrastructure. Explanatory text on the maps provides information on the geologic age of the materials as well as their physical properties.
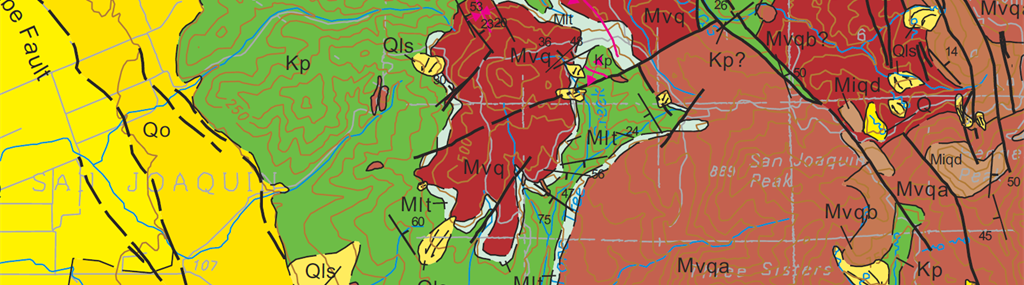
A segment of a typical geologic map is shown at the top of this page. On the map the geologist has recorded the locations, types, and ages of the rock units and surficial materials by using various standard colors, symbols and patterns overlain on a topographic base map. The basic rock units shown on the map are called formations. For example on the map the green area labeled "Kp" shows the areal extent of the Panoche Formation of Cretaceous age. Similarly, the red portion of the map labeled "Mvqa" represents in map view the areal extent of an unnamed formation composed of a volcanic rock called andesite of Miocene age. A formation is usually named after a geographic feature (mountain, canyon, or town) near the area where the unit was first identified. The geologically most recent deposits on the map are the landslides ("Qls") depicted in yellow with arrows showing the direction of movement or "flow". Using special symbols, the geologist has recorded other significant observations on the map such as faults (bold black lines), folds, contacts between rock units, and the strike and dip of formations (respectively, the direction of a horizontal line within a unit and the angle that the unit slopes in outcrop). The explanatory text for the geologic map above is not shown.
Use of Geologic Maps
A geologic map is the principal tool of a geologist or engineer who either needs to convey or decipher information about the Earth’s surface. Geologic maps are used to interpret the structure, stratigraphy, mineralogy, paleontology, and the historical record of the Earth’s crust. Geologic maps are used to locate energy resources (such as petroleum, natural gas, coal, and geothermal resources). They are used to locate sources of groundwater and mineral deposits (such as gold, iron, copper, clay and construction aggregate). Geologic maps are also used to identify areas that may contain potential mineral hazards, such as mercury, asbestos, or radon. Geologic maps are used to identify potential geologic hazards such as landslides, earthquake fault zones, areas susceptible to liquifaction, historic flood zones, volcanoes and areas susceptible to tsunamis. Geologic maps are used by land-use planners to identify and determine which areas are suitable for agriculture and urban development. They are a fundamental resource for environmental and engineering applications. Geologic maps provide an enormous amount of information needed to understand the Earth and to understand the geology of other planets by comparison.
Value of Geologic Maps
The value of geologic maps is illustrated by the direct economic gain from the discoveries of energy resource deposits (coal, natural gas, oil, or geothermal sources), industrial mineral resource deposits (iron-ore, copper, construction aggregate, limestone, borates, or rare-earth deposits), and precious mineral resource deposits (gold, silver, or gemstones). Indirect socioeconomic value is gained through the use of geologic maps for making wise land-use planning and safe engineering decisions. Such decisions are based on avoidance of natural hazards, optimizing site conditions for construction projects, and conserving natural resources.
CGS Programs that Produce Geologic Maps
The CGS produces professional geologic maps at various scales, and derivative maps showing important aspects of geologic hazards or resources. Programs at CGS that produce geologic maps and derivatives of geologic maps are described briefly below.
Regional Geologic and Landslide Mapping Program
The Regional Geologic and Landslide Mapping Program maps and compiles the geology of the state with the objective of developing a statewide geologic map database. Detailed maps at 1:24,000 and compilations at 1:100,000 are initially released on CGS’s preliminary geologic maps web page and the completed maps are published in CGS’s Regional Geologic Map series. These efforts are partly supported by the U.S. Geological Survey through the National Cooperative Geologic Mapping Program.
The RGMP has also produced Statewide Geologic Maps at various scales, and Regional Geologic Maps at 1:250,000 scale. Currently the 2010 State Geologic Map of California (Geologic Data Map No. 2) at 1:750,000 scale (1 inch = approximately 12 miles) is the most detailed statewide map. A simplified geologic map at 1:2,250,000 scale is also available. The more detailed Regional Geologic Maps at 1:250,000 scale are available for the entire state as part of the Geologic Atlas of California series or the Regional Geologic Map series. As mentioned above, more recent maps in the Regional Geologic Map series are being prepared at 1:100,000 scale. These are available from our Preliminary Geologic Maps web page. Many CGS geologic maps can also be found through the CGS Information Warehouse.
Mineral Resources and Mineral Hazards Mapping Program
The Mineral Resources and Mineral Hazards Mapping Program produces geologic maps of areas being classified for mineral resources (mineral land classification), and of areas where naturally occurring mineral hazards (asbestos, mercury, and radon) are more likely to occur.
Forest and Watershed Geology Program
The Forest and Watershed Geology Program prepares geologic maps and maps of geomorphic features related to landsliding as well as engineering geologic review of Timber Harvesting Plans, and other regional scale documents.
California Seafloor Mapping Program
The California Seafloor Mapping Program is a completed USGS cooperative effort to create a comprehensive coastal/marine geologic and habitat base map series for California’s state waters. The CSMP prepared habitat and geologic base maps for all of California’s state waters (mean high water line out to three nautical miles). The CGS contributed to onshore-offshore geologic maps which are published as part of a series by USGS. CGS’s efforts were partly supported by the California State Coastal Conservancy.
Derivative Maps based on California Geologic Maps: Proceedings from Digital Mapping Techniques 2010
In 2010 the California Geological Survey hosted “Digital Mapping Techniques”-- an annual conference presented by the U.S. Geological Survey and the Association of American State Geologists . The workshop was attended by 110 technical experts from 40 agencies, universities, and private companies, including representatives from 19 State geological surveys. The objective was to foster informal discussion and exchange of technical information. In addition to the long-standing emphasis of DMT conferences on digital recording of field data and digital production of geologic maps, CGS participants emphasized the digital production of derivative maps based on geologic maps. The proceedings of DMT 2010 have been published by the USGS and are available at
https://pubs.usgs.gov/of/2012/1171/. Papers by CGS authors are available on that web site, and are listed below:
-
Derivative maps from geologic maps: Hazard mitigation and resource planning
By Chris J. Wills (California Geological Survey)
-
Utility of combined aerial photography and digital imagery for fault trace mapping in diverse terrain and vegetation regimes
By Jerome A. Treiman, Florante G. Perez, and William A. Bryant (California Geological Survey)
-
California Geological Survey Zones of Required Investigation for earthquake-induced landslides—Livermore Valley, California
By Florante G. Perez, Wayne D. Haydon, and Mark O. Wiegers (California Geological Survey)
-
California Geological Survey Zones of Required Investigation for Liquefaction—Livermore Valley, California
By Anne M. Rosinski (California Geological Survey)
-
Using digital geologic maps to assess alluvial-fan flood hazards
By Jeremy T. Lancaster, Thomas E. Spittler, and William R. Short (California Geological Survey)
-
Digital mapping of potential mineral and geochemical hazards in California: Examples for naturally occurring asbestos, radon, and highway corridor mapping projects
By John P. Clinkenbeard, Ronald K. Churchill, and Chris T. Higgins (California Geological Survey)
-
Assessing erosion potential and Coccidioides immitis probability using existing geologic and soils data
By Will J. Harris and Peter D. Roffers (California Geological Survey)
