Summary of effects in California, and the state's response
Updated May 19, 2022
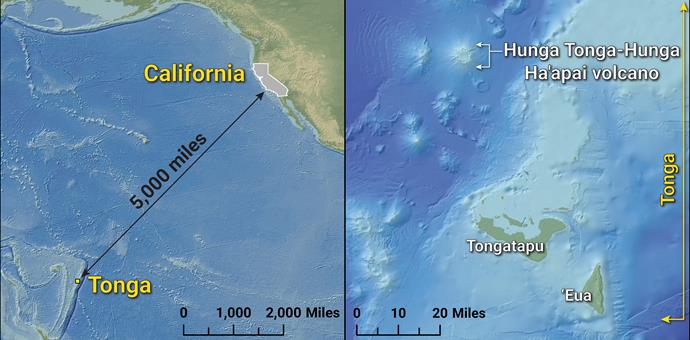 Tonga-California reference maps. On the left is a map that shows where Tonga and California are, relative to each other; there are about 5,000 miles of open water between Tonga and California. On the right is a map of the southern Kingdom of Tonga, showing the location of the Hunga Tonga-Hunga Ha'apai volcano relative to the largest island in Tonga, Tongatapu. Click/tap the image to open a high-resolution version. Credit: Jason R. Patton, California Geological Survey.
The Volcanic Eruption
Hunga Tonga-Hunga Ha'apai is an uninhabited volcanic island located in the southwest Pacific Ocean between New Zealand and Fiji, to the northwest of Tonga. Beginning on January 14, 2022 the volcano erupted, generating a plume of ash that rose more than 20 kilometers (12 miles) above sea level. The next day there was a larger, more violent eruption that created an ash plume 600 kilometers (375 miles) in diameter. This explosive eruption produced a tsunami that affected the entire Pacific Ocean, and atmospheric pressure waves that circled Earth several times. After the eruption, satellite images show that 90% of the island is no longer visible.
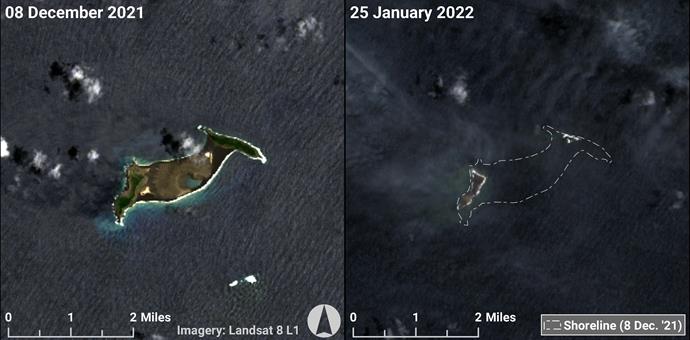 Before and after. On the left is a satellite image of Hunga Tonga-Hunga Ha'apai before the January 15 eruption. On the right is an image of the same location after the eruption, showing most of the island is gone. The pre-eruption shoreline is shown as a dashed line on the second image. Click/tap the image to open a high-resolution version. Source: USGS Landsat 8 L1 true color satellite imagery.
Tsunami Impact in California
The tsunami was recorded on tide gages up and down the coast of California. The maximum tsunami amplitudes or surges corresponded with the peak daily tides which increased the potential for flooding along parts of the coast.
The Tonga tsunami was the first to flood on land in California since the 1964 tsunami generated by the Good Friday Earthquake in Alaska; and although the 2011 Tōhoku-oki tsunami caused significantly more damage to harbors, it occurred at a relatively low tide, resulting in no notable flooding. Because the maximum amplitudes of the Tonga tsunami corresponded with peak high-tide conditions, many beaches and several harbors in northern and central California experienced minor to moderate flooding. Santa Cruz and Ventura suffered the most significant damage among California harbors.
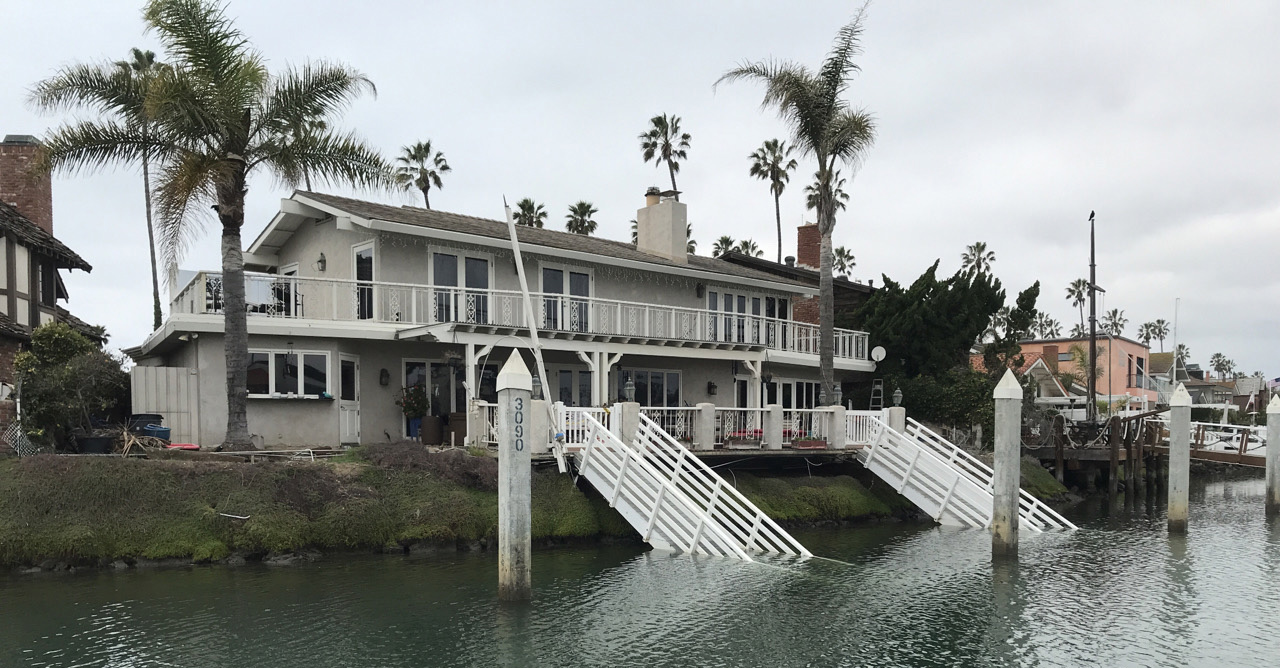 Dock ramps damaged by the Tonga tsunami at Ventura Harbor. Click/tap the image to open a high-resolution version. Credit: Michael DeFrisco, California Geological Survey.
Summary table of tsunami size as recorded at NOAA tide gages along the coast of California.
Wave Height is wave size measured from peak to trough. Amplitude is height of wave above ambient water surface elevation. Elevation is height of wave above mean lower low water (tidal datum). Source: Patton et al., 2022 from data provided by the National Oceanic and Atmospheric Administration (tidesandcurrents.noaa.gov). CORRECTION (March 1, 2022): A previous version of this table had transposed the definitions of Wave Height and Amplitude. The error has been corrected.
| Crescent City |
1.73 |
0.99 |
3.00 |
| North Spit |
0.55 |
0.36 |
2.57 |
| Arena Cove |
2.14 |
1.34 |
2.94 |
| Point Reyes |
1.75 |
0.83 |
2.50 |
| San Francisco |
0.57 |
0.36 |
2.16 |
| Richmond |
0.61 |
0.22 |
2.15 |
| Martinez |
0.40 |
0.20 |
1.77 |
| Alameda |
0.51 |
0.24 |
2.29 |
| Redwood City |
0.05 |
0.14 |
2.62 |
| Monterey |
1.42 |
0.81 |
2.50 |
| Port San Luis |
2.61 |
1.36 |
2.94 |
| Santa Barbara |
1.11 |
0.70 |
2.17 |
| Santa Monica |
0.96 |
0.63 |
2.25 |
| Los Angeles |
0.76 |
0.47 |
2.04 |
| La Jolla |
0.40 |
0.32 |
1.88 |
| San Diego |
0.60 |
0.47 |
2.21 |
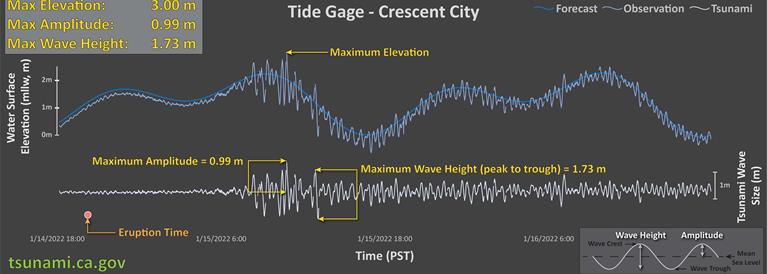 Plot of tide gage data from Crescent City, California. Click/tap the image to open a high-resolution version. The dark blue line represents the tidal forecast. The medium blue line shows the raw tide gage data. The light blue line represents the size of the wave above or below the forecast (i.e., "residual"). We measure maximum elevation from the observed data. We measure maximum wave height and maximum amplitude from the residual data, the light blue line. Credit: Jason R. Patton, California Geological Survey, from data provided by the National Oceanic and Atmospheric Administration (tidesandcurrents.noaa.gov).
Updates
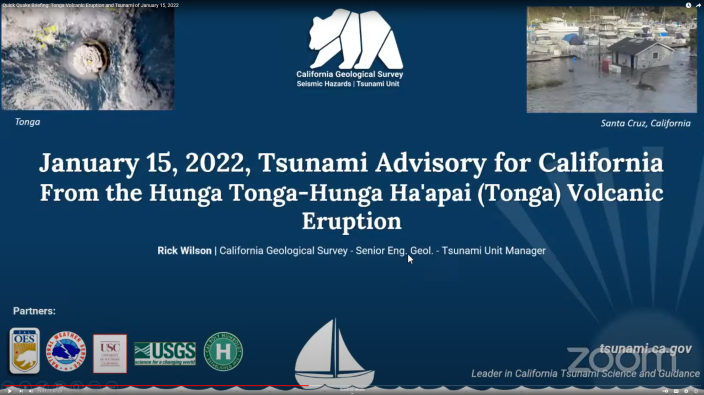
February 25, 2022 - Rick Wilson, CGS Tsunami Unit Manager, presents updated findings and information in this video briefing on the Tonga Tsunami:
California's Response to the Tonga Tsunami
Initial Action and Alerts
During an event like the Tonga tsunami, there are a series of hourly communiques between the California Tsunami Program (CTP) and the National Tsunami Warning Center (NTWC). The CTP members then hold online meetings with officials from cities, counties, and ports and harbors to help relay the information about the tsunami forecasts and provide information on the likely impacts for California.
For California, the NTWC issued an Advisory-level alert for the Tonga tsunami; Advisory-level tsunamis are forecast to have waves as large as 1 meter (about 3 feet) above the ambient water level. Coastal jurisdictions were advised to evacuate people from beaches, shorelines, harbor docks, and live-aboard vessels in harbors and marinas. The alert was cancelled after about 19 hours. Considering the tsunami's forecast size and subsequent effects, beach and harbor evacuations were appropriate for this event.
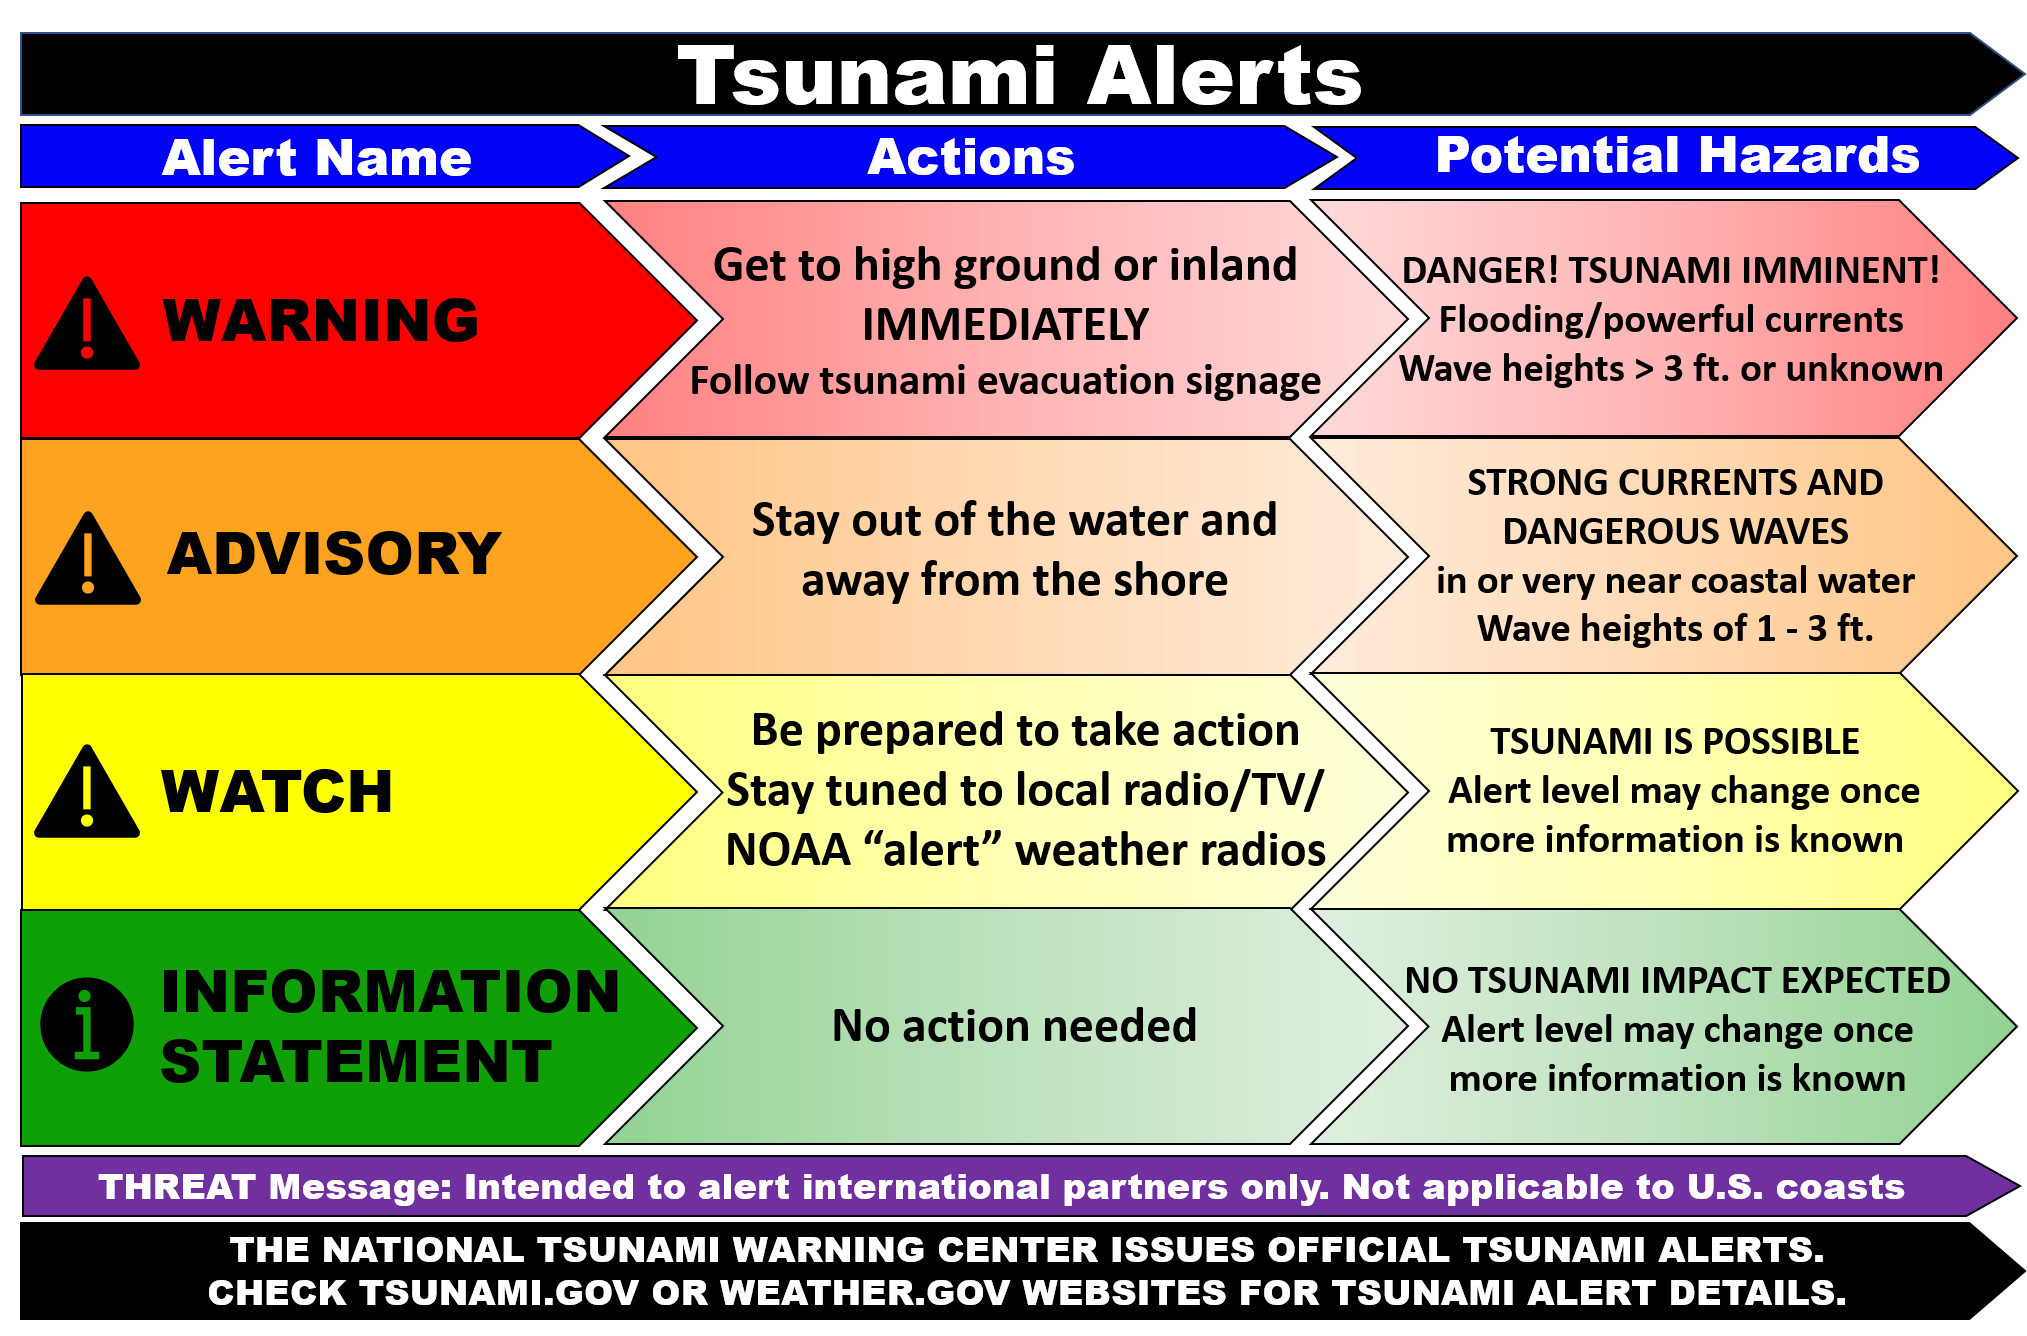 The four levels of tsunami alerts used by the National Tsunami Warning Center. INFORMATION STATEMENT means that no tsunami is expected; WATCH means that a tsunami is possible; ADVISORY means that strong currents and waves between 1 and 3 feet may occur; WARNING means that tsunami waves and strong currents are imminent. Click/tap the image to open a high-resolution version. Credit: National Tsunami Warning Center, National Oceanic and Atmospheric Administration.
Field Reconnaissance and Data Collection
The CGS natural disaster response program is designed to collect observations from geologic hazard events, including earthquakes and tsunamis. The response effort for the Tonga tsunami is comprised of several field teams deployed to coastal areas to make observations of tsunami inundation and other impacts, and to interview people who either witnessed the tsunami, managed coastal resources, or protected people during the event. The CGS field response teams also work with scientists and engineers from the U.S. Geological Survey, the University of Southern California, and Cal Poly Humboldt to coordinate efforts and share information. The information gathered helps us understand these events better and improve preparedness and response strategies.
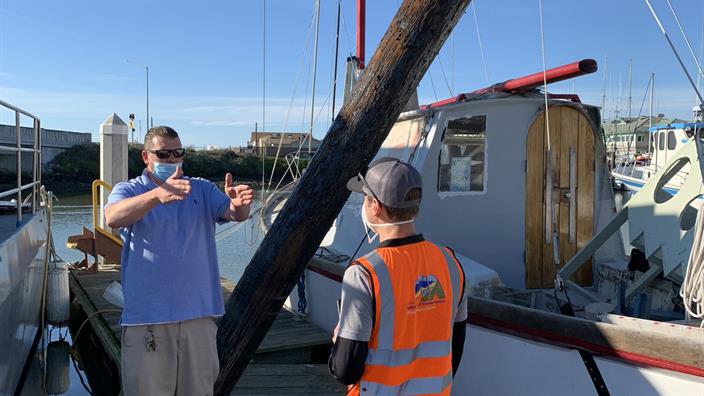 Assessing tsunami damage at Moss Landing. CGS Engineering Geologist Nicholas Graehl interviews a boat owner during post-tsunami reconnaissance efforts. Click/tap the image to open a high-resolution version. Credit: Jaqueline Bott, California Geological Survey.
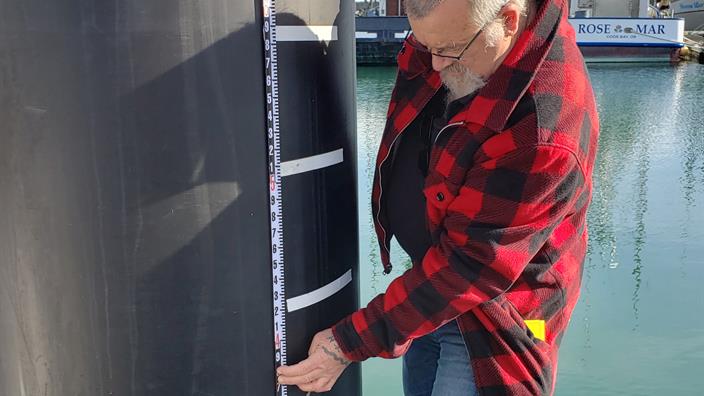 Measuring tsunami high-water marks on a dock piling. At the Crescent City Boat Basin, CGS Engineering Geologist Jim Falls measures the height of markings (white tape) placed by an individual who witnessed the tsunami. Click/tap the image to view the complete version. Credit: Jason R. Patton, California Geological Survey.
How You Can Help Us
If you have information about damage or impacts from the tsunami, or if you have video footage or photos to share, please use our California Tsunami Reconnaissance Survey to upload these important resources. The reconnaissance survey is somewhat long, so at a minimum enter your name and contact information as you skip to page 3 where there is a place to upload your content.
Back to the Tsunamis home page
Web page by:
California Geological Survey - Seismic Hazards Program
Last modified: May 19, 2022
